

City GIS Division Providing Pathway for Data to Become Decision-Making
The world of Geographic Information Systems, or GIS, centers on managing data. That is a simple enough definition, but it doesn’t exactly describe in detail why it works and how it is so effective.
And so, digging into what GIS really does, becomes rather daunting until you look at the products it produces. As you see these projects, you start to get a better sense of the power of a system and approach that is a little bit art, and a little science, but the end result is something every department in the City of Bismarck can utilize.
Presently, there are more than 100 maps that city departments use, with files ranging from as small as kilobytes, or as large as a terabyte, delivering a variety of information. The City’s interactive map gallery, a public portal with a variety of maps, boasts a variety of interesting, evolving points of data at bismarcknd.gov/20/GIS-Maps.
So, what is GIS?
The City of Bismarck’s first steps in the realm of GIS began in 1998. At that time GIS was housed in the City’s Community Development department. As people became more familiar with the applications, and departments requested more services, it made more sense to house GIS with an IT division that was housed as part of the finance department in 2003 because of its connection to ever-evolving technology.
Darrel Nucech’s fascination with components of GIS began early on. A student of land spaces took Nucech through bachelor’s and master’s degrees in geography and built his foundation on a career with the City of Bismarck that began in 2009.
“I’ve always loved maps,” said Nucech. “And I’ve always loved natural resources, I love to hunt and fish, and so I feel like this path made sense. I came to Bismarck looking to help and to learn. Initially, I thought I would work here for a few years and move on to another organization, but I have found I love Bismarck a lot. I’ve worked my way up from a GIS technician to an analyst, and eventually, the GIS coordinator position opened up and I was selected for that.”
At its core, GIS is a tool that helps understand and manage large quantities of numbers and data. Think of it in these terms: To explain where Bismarck is located in North Dakota, you could tell someone that Bismarck is located about a third of the state away from South Dakota, two-thirds of the state away from Canada, and about 150 miles from Montana and 200 miles from Minnesota. Or you could create a visual representation of those data points, commonly known as a map.
“That it is easily understandable is the real power of a map,” said Nucech. “They are an incredible visual tool.”
But the map component just scratches the surface of how GIS can help manage information. As you begin to track data occurring at a specific location, you can use the computing power that takes seconds to do what a group of individuals may need hours to create. The information created from this system allows for more informed decisions to be made. But the purposeful planning that goes into the creation of a dashboard means ensuring that the right data is captured and that it will continue to be available, so the system can always create that apples-to-apples comparison that makes comparing data over time effective.

“Sometimes you end up creating more work,” said Nucech. “The system is pretty dynamic but you can get part way through a project and maybe we learn the information might be more useful if it is conveyed differently. So, purpose and audience are two things you want to remember.”
“The biggest thing recently is that GIS has all these applications that are open to the public through the Internet,” said Nucech. “We get maps into everyone’s hands and information at their fingertips. It can be communicated much more easily than it could before. It used to be that we had to export and create copies of data, where now, as soon as you update it, it shows that change.”
Today, the city’s website houses 39 public maps tracking information such as the city’s bike racks, Bismarck’s flood zones, land parcels, zoning districts, and a dashboard of incidents that Bismarck police officers respond to. These maps are dynamic, layers can be clicked on and the data is interactive.
“Years ago, we used to have to wait until the end of the day to make updates, because we didn’t want to have to kick people out of the system to make one little change,” said Nucech. “Now the systems have advanced to where we can make all of the updates without interrupting the user experience.”
Three projects with three different departments (Police, Public Works Service Operations, and Public Works Utility Operations) begin to paint a descriptive picture showing the use of GIS.
Police Department Application
In May 2023, the Bismarck Police Department unveiled a public-facing dashboard displaying crime, service, and traffic statistics for the city over 24 hours, and 3, 7, 14, and 30 days. The statistics are represented by color (red for crime, yellow for traffic, and blue for service incidents), and the larger the number of occurrences, the larger the colored dot becomes at that location.
Depending on how zoomed in your view of the map is will determine how combined the data will present itself. As you zoom in on the map, the location of incidents will become more specific.
With this data, the police department can work off real-world data to determine times when more officers may be needed to work shifts, areas of town that may need a higher volume of patrols, and departments such as Engineering and Community Development can see if there are specific areas of town that are experiencing higher traffic incidents and start the conversation on potential mitigation needs.
“It’s interesting—when I started working for the city, GIS wasn’t even a thought,” said Bismarck Police Chief Dave Draovitch. “But it is very helpful for law enforcement to see things on a map. It helps us solve crimes and see patterns so we can address issues that need attention.”
Along with the heat map, the total amount of the three types of responses is totaled and various subgroups are denoted. These subgroups give a more complete picture of the workload that the police department performs. In early March, as an example, there were an estimated 910 crime incidents displayed over the previous 30 days. These incidents included trespassing (5.2%), forgery/ counterfeit (2.6%), DUI or APC (7%), warrant (5.9%), harassment (3.1%), theft (8.6%), suspicious activity or person (14.3%), noise complaint (6.3%) shoplifting (7.5%), unwanted subject (13.7%), motor vehicle theft (3.1%), burglary (3.8%), vandalism (3%), and disorderly conduct (4.9%).
“I get to see the passion of our police officers nearly every day,” said Draovitch. “When I have the opportunity to meet with GIS personnel, I see that same passion. They love what they do and it shows when they are helping you to solve a problem.”
Street Lights Application
There are nearly 9,500 streetlights maintained by Public Works Service Operations staff within the City of Bismarck and every year that number increases. For years, these lights were High Pressure Sodium (HPS) lights, but in recent years, finding parts for these lights has become increasingly difficult, and the quality of the lights has decreased in many aspects.
This, coupled with the rise of Light Emitting Diode (LED) lights, has caused the city to begin switching from the old technology to new. The LED lights use about 60% less power than their HPS predecessors and are expected to last longer and require less maintenance. These benefits mean less street traffic impact through repairs and also mean staff will face fewer hours working in a potentially dangerous roadway. However, to manage this changeover, a system was needed to manage the catalog of information in steps GIS.
In working with Nucech and his staff, Public Works was able to enter the location of all the lights, determine where the greatest need for the new lights existed, and begin the changeover process.
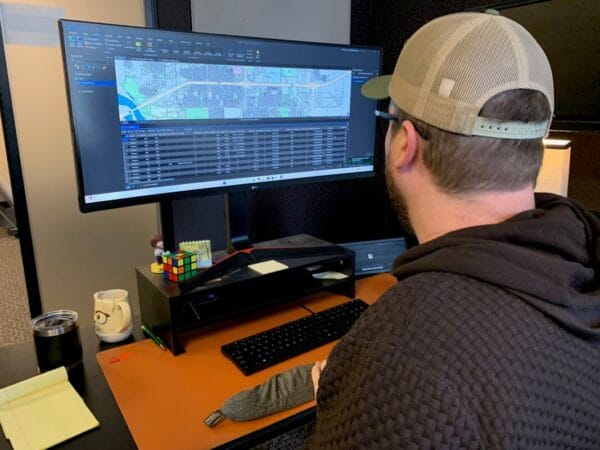
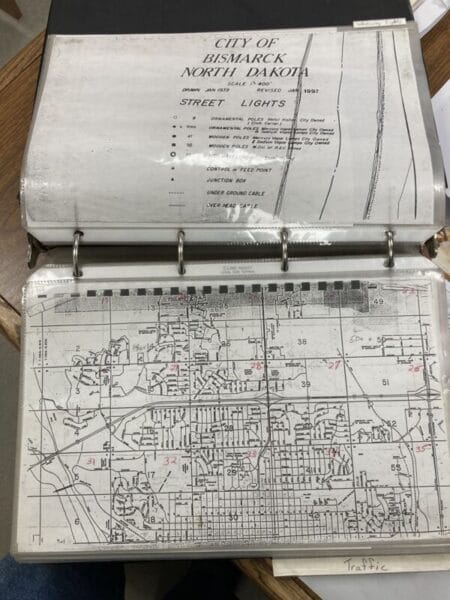
“Before we had GIS, we had to utilize 11×17 paper maps,” said Traffic Maintenance Superintendent Paul Lies. “These maps were black and white and very hard to read. The GIS system has made doing our jobs much easier than it used to be, with far more accurate information. We now have the ability to use aerial photos, identifiers, and zoom features. Having this system has made creating projects that keep our infrastructure up to date and gives us the ability to move towards a preventative maintenance program instead of a reactive maintenance program.”
As GIS has become more mainstream, and the systems used have become more user-friendly, Nucech and his staff have been able to create systems that other departments maintain. And so when Public Works upgrades a section of HPS lights for the LED versions, their own staff perform data entry and free up GIS staff for their next project.
“I have worked with GIS staff since the beginning,” said Lies. “They have always been very helpful and good to work with. And knowledgeable … the work they do has really been a benefit to staff and budgets and so that means they benefit our citizens, too.”
Sanitary Sewer Application
Running beneath the surface of the City of Bismarck is hundreds of miles of piping. This network of pipes brings necessary water from the City’s water treatment plant to homes and then transports water away from a home, to the wastewater treatment plant.
Tracking data such as the pipe size, length, and material would be nearly impossible on a paper map. But with a GIS system in place, this task is suddenly manageable.
“All of our water and sewer infrastructure is housed within GIS maps that we use for utility locating, planning, tracking historical data, record drawing review, and creating work orders for our staff,” said Matt Routledge, the City’s Water Distribution and Collections Supervisor. “Outside of our regular daily uses, GIS has helped our staff by creating dashboards for hydrant snow removal and quickly identifying water and sewer pipe material, size, length, and quantity in the city. GIS created maps that allow us to GPS all water curb stop shutoffs in the city and most recently, they are active in supporting our needs with the new Lead and Copper Rule set forth by the EPA to help keep us in compliance.”
Public Work Utility Operations has been using software from the Environmental Systems Research Institute (ESRI) to keep track of maintenance activities for four years. The flexibility of the ArcGIS software to run on a variety of platforms has been key to its success.
“It is the first thing I open up on my computer each morning and it even works great on an iPad or phone,” said Routledge. We used to have laptops for all of our employees to have access to GIS, measurements, and record drawings. Now, we can access it all on our phones so we no longer need laptops for everyone.”
“I’m not an expert in water distribution systems,” said Nucech. “But I can get the information that I need from them and update the data for what they need to do their job.”
Engineering Application
Another department that uses GIS daily is Engineering. The department maintains a database of as-built drawings showing the various infrastructure they help manage.
“GIS weaves together different data sets that can be simultaneously visualized to help answer questions and inform decisions,” said City Engineer Gabe Schell. “It also serves as a data gathering function for the public to voice their input on proposed improvements and for staff to collect geospatial specific data in the field.”
Most of the project collaboration between Engineering and GIS starts with a problem, and the two sets of staff work towards a path to fix that problem. These projects include survey applications, maps, data management, as-built drawings, aerial drone survey processing, and capital improvement planning. GIS has developed into an indispensable tool that contributes to the efficient delivery of municipal services for all departments and helps with informed decision-making. And in looking at all the projects that have been created, the projects of tomorrow appear to know no boundaries, as these scopes continue to expand the ways the City of Bismarck serves its citizens.